I’ve been interested in finding incident reports since I started writing this blog. In a world that seems so inherently dangerous but sells itself on being safe, I’ve been really curious what the data actually said. In this article I’m going to tell you how I found the incidents that have been reported to the Florida Government, cleaned most of it and converted it to a spreadsheet that I could actually analyse with some basic plots. Get in touch through the contact page if you’d like a copy of the original data or the final cleaned version to play with.
Finding the data

Some Google searching managed to turn up some reports from WDWinfo and the Orlando Sentinel (not available in EU) which seemed to link to a Florida government site that has one document that appears to be continually updated through the same link.
I thought this was a bit of luck! If they were just updating the same page then I could theoretically set up a script to check it each quarter and update my data sheet. Unfortunately that fell apart really quickly as I realised it was a pdf file and pretty much impossible to read with my current skills. So I decided to do something unforgivable and just copypaste the whole thing into a spreadsheet – definitely not scalable! Little did I know that scalability would be thrown out the window very quickly as I started working with it in Python.
Pandas, but not that kind
To get this data into some sort of shape I decided to use the regex functions provided by re and pandas modules in Python. This decision was mainly because
Python is much faster dealing with strings than R, and pandas is a really useful (and R-like) module to make data handling even more simple.
I tried to just read it in using pandas at first, but there were way too many random commas for it to handle. That left my only option being importing the whole thing as strings, stick all the strings together and figure out how to split it myself. Thankfully there was at least a tiny bit of standardisation in the file – each line
started with a date that had a space in front of it. After a long time figuring out the regex for a date, I just started reading through regex tutorials which was really boring but really useful! From there I started pulling out whatever information I could using any patterns I could see.
import pandas as pd
import re
import csv

# I use the csv module here to read in the file because pandas was doing too much formatting for me
i = ""
with open("unformatted_incidents.csv", 'rb') as csvfile:
    incidentreader = csv.reader(csvfile)
    for row in incidentreader:
        for item in row:
            i = i + " " + str(item)

# This giant clumsy regex is to get rid of all the theme park names that snuck into the copypaste
i = re.sub(r"Wet.{1,10}Wild:|Disney:|Universal:|Sea World:|Busch Gardens:|Disney World:|Legoland:|None [Rr]eported|/{0,1}MGM:{0,1}|Epcot,{0,1}|USF|Adventure Island|Magic Kingdom", "", i)

# Now I split it on the space before each date it sees - you'll see this didn't quite work in the end.
splitlist = re.split(r' (?=[0-9]{1,2}/[0-9]{1,2}/{0,1}[0-9]{2})', i)

#Convert my list of lists into a one-column data frame
incidents = pd.DataFrame(splitlist, columns = ['a'])

# Each date has a space after it so I split on that space to get a date column
incidents['date'], incidents['stuff'] = incidents['a'].str.split(' ', 1).str
# The age of the person is the only digits left in the strings
incidents["age"] = incidents.stuff.str.extract("(\d+)", expand = True)
# The gender of the person is always in similar positions so I do a positive lookbehind to find them
incidents["gender"] = incidents.stuff.str.extract("((?<=year old ).|(?<=yo).)", expand = True)
# I look for any words before the age of the person, that's usually the ride (not always though!)
incidents["ride"] = incidents.stuff.str.extract("(.* (?=[0-9]))", expand = True)
# incidents = incidents.drop(['a'], axis = 1)
incidents.drop(incidents.index[0], inplace=True)
print incidents
incidents.to_csv("incidents.csv")
This script gave me a relatively clean dataset of around 560 incidents from 2003 – 2018 that I could at least import into R. I was celebrating at this stage thinking the pain was over, but little did I know what was to come…
Cleaning and plotting in R
 Now that I had something I could load, it was time to have some fun with graphs. But before I could do that, I needed to actually examine the data a bit more. This all looked fine at first – most things had a date and age and gender, but when I looked at the levels of the ‘rides’ column my blood turned cold as I realised how human generated this data really was. I had 206 rides in the set, but as I started scrolling through them, almost all of them had duplicates with different spelling, capitalisations and punctuation. Spiderman was both “Spider Man” and “Spider-Man”. And don’t even talk about the Rip Ride Rockit and the million spellings they’ve used over the years in the report. This meant a LOT of dumb and non-scalable coding to clean it up:
library(data.table)
library(ggplot2)
incidents <- fread("~/Data/dis_incidents.csv")
incidents <- incidents[, V1 := NULL][,date := as.POSIXct(date, format = "%m/%d/%y"), ][, ride := as.factor(ride),][, condition := grepl("pre[-| |e]", incidents$stuff), ][, year := year(date)][!is.na(date)][year < 2019]

levels(incidents$ride) <- trimws(levels(incidents$ride), which = "both")
levels(incidents$ride) <-gsub(",|;|/.", "", levels(incidents$ride))

levels(incidents$ride) <- tolower(levels(incidents$ride))
levels(incidents$ride)[levels(incidents$ride)%like% "rock" & !levels(incidents$ride)%like% "rip"] <- "rock n rollercoaster"
levels(incidents$ride)[levels(incidents$ride)%like% "soar"] <- "soarin"
levels(incidents$ride)[levels(incidents$ride)%like% "under"] <- "under the sea jtlm"
levels(incidents$ride)[levels(incidents$ride)%like% "storm"] <- "storm slides"
levels(incidents$ride)[levels(incidents$ride)%like% "transformers"] <- "transformers"
levels(incidents$ride)[levels(incidents$ride)%like% "mission"] <- "mission space"
levels(incidents$ride)[levels(incidents$ride)%like% "hulk"] <- "incredible hulk coaster"
levels(incidents$ride)[levels(incidents$ride)%like% "sim"] <- "the simpsons"
levels(incidents$ride)[levels(incidents$ride)%like% "men"] <- "men in black"
levels(incidents$ride)[levels(incidents$ride)%like% "kil"] <- "kilimanjaro Safaris"
levels(incidents$ride)[levels(incidents$ride)%like% "tom"] <- "tomorrowland speedway"
levels(incidents$ride)[levels(incidents$ride)%like% "harry potter" & levels(incidents$ride)%like% "escape"] <- "hp escape from gringotts"
levels(incidents$ride)[levels(incidents$ride)%like% "harry potter" & levels(incidents$ride)%like% "forbid"] <- "hp forbidden journey"
levels(incidents$ride)[levels(incidents$ride)%like% "pirate"] <- "pirates of the caribbean"
levels(incidents$ride)[levels(incidents$ride)%like% "honey"] <- "honey i shrunk the kids"
levels(incidents$ride)[levels(incidents$ride)%like% "caro-"] <- "caro-seuss-el"
levels(incidents$ride)[levels(incidents$ride)%like% "buzz"] <- "bl spaceranger spin"

levels(incidents$ride)[levels(incidents$ride) %like% "everest"] <- "expedition everest"
levels(incidents$ride)[levels(incidents$ride) %like% "astro"] <- "astro orbiter"
levels(incidents$ride)[levels(incidents$ride) %like% "typhoon"|levels(incidents$ride) %like% "wave pool"|levels(incidents$ride) %like% "surf pool" ] <- "typhoon lagoon"
levels(incidents$ride)[levels(incidents$ride) %like% "tob"] <- "toboggan racer"
levels(incidents$ride)[levels(incidents$ride) %like% "progress"] <- "carousel of progress"
levels(incidents$ride)[levels(incidents$ride) %like% "rip" & !levels(incidents$ride) %like% "saw"] <- "rip ride rockit"
levels(incidents$ride)[levels(incidents$ride) %like% "knee"] <- "knee ski"
levels(incidents$ride)[levels(incidents$ride) %like% "spider"] <- "spiderman"
levels(incidents$ride)[levels(incidents$ride) %like% "seas"] <- "seas w nemo and friends"
levels(incidents$ride)[levels(incidents$ride) %like% "terror"] <- "tower of terror"
levels(incidents$ride)[levels(incidents$ride) %like% "dinos"] <- "ak dinosaur"
levels(incidents$ride)[levels(incidents$ride) %like% "bliz"] <- "blizzard beach"
levels(incidents$ride)[levels(incidents$ride) %like% "space m"] <- "space mountain"
levels(incidents$ride)[levels(incidents$ride) %like% "drag" & levels(incidents$ride) %like% "chal"] <- "dragon challenge"
levels(incidents$ride)[levels(incidents$ride) %like% "drag" & levels(incidents$ride) %like% "chal" |levels(incidents$ride) %like% "duel" ] <- "dragon challenge"
levels(incidents$ride)[levels(incidents$ride) %like% "dragon coas"] <- "dragon coaster"
levels(incidents$ride)[levels(incidents$ride) %like% "rapid"& levels(incidents$ride) %like% "roa"] <- "roa rapids"
levels(incidents$ride)[levels(incidents$ride) %like% "riverboat" | levels(incidents$ride) %like% "liberty"] <- "liberty riverboat"
levels(incidents$ride)[levels(incidents$ride) %like% "jurassic"] <- "camp jurassic"
levels(incidents$ride)[levels(incidents$ride) %like% "seven"] <- "seven dwarves mine train"
levels(incidents$ride)[levels(incidents$ride) %like% "prince"] <- "prince charming carousel"
levels(incidents$ride)[levels(incidents$ride) %like% "toy"] <- "toy story mania"
levels(incidents$ride)[levels(incidents$ride) %like% "peter"] <- "peter pans flight"
levels(incidents$ride)[levels(incidents$ride) %like% "mayd"] <- "mayday falls"
levels(incidents$ride)[levels(incidents$ride) %like% "crush"] <- "crush n gusher"
levels(incidents$ride)[levels(incidents$ride) %like% "test track"] <- "test track"
levels(incidents$ride)[levels(incidents$ride) %like% "manta"] <- "manta"
levels(incidents$ride)[levels(incidents$ride) %like% "despic"] <- "dm minion mayhem"
levels(incidents$ride)[levels(incidents$ride) %like% "passage"] <- "flight of passage"
levels(incidents$ride)[levels(incidents$ride) %like% "mummy"] <- "revenge of the mummy"
levels(incidents$ride) <- gsub("e\\.t\\.", "et", levels(incidents$ride))

ridesort <- incidents[, .N, by = ride][1:10]
ridesort$ride <- factor(ridesort$ride, levels = ridesort$ride[order(-ridesort$N)])
ggplot(data = incidents[!is.na(age)], aes(age)) + geom_histogram(breaks=seq(0, 95, by =5), col=" blue", fill="black") + ggtitle("Florida theme park reported incidents by age") + xlab("Age") + ylab("Incidents") + scale_x_continuous(breaks = seq(0, 100, by = 5))


ggplot(data = incidents[!gender == ""][ride %in% c("expedition everest", "prince charming carousel", "typhoon lagoon")], aes(gender)) + geom_histogram(breaks=seq(0, 95, by =2), col=" blue", fill="black", stat = "count") + theme(legend.position="none") + ggtitle("Florida theme park reported incidents by gender") + xlab("Gender") + ylab("Incidents") + facet_wrap( ~ ride)

ggplot(data = incidents[!gender == ""], aes(x= year)) + geom_histogram(col=" blue", fill = "black", binwidth = 1) + theme(legend.position="none") + ggtitle("Florida theme park reported incidents by year") + xlab("Year") + ylab("Incidents") + xlim(c(2002, 2018))

ridesort$ride <- factor(ridesort$ride, levels = ridesort$ride[order(-ridesort$N)])
ggplot(data = ridesort, aes(x = ride, y = N)) + geom_col(col = "blue", fill = "black") + theme(axis.text.x = element_text(angle = 90, hjust = 1)) + ggtitle("Florida reported incidents by ride")
Now I’m totally willing to hear about any way I could have done this better, but to be honest with the exception of a few &’s and |’s I don’t see how it could have been much shorter. The problem is that when you have humans typing data themselves and submitting it to the government as a document, there is very little control over standardisation. Having cut my 206 rides down to 112 by merging duplicates, I can actually get some interesting graphs and numbers.
Results
The first thing I did was to check out how many people in the list had pre-existing conditions. About 14.8% of people had pre-existing conditions reported, which only tells us that being healthy generally doesn’t really protect you from a theme park accident.
Demographics
From here the next interesting things were to look at incidents by the very few demographic variables I was able to get:
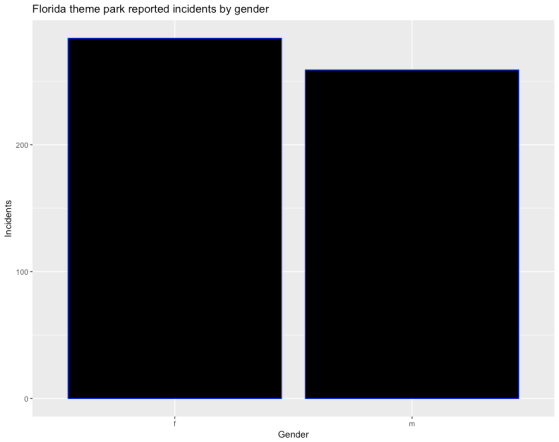
This could have been interesting to see, but it’s pretty much as you’d expect – men and women have about the same number of incidents as each other. This seems to play out across all the rides except a couple of them. Here’s the three with the biggest differences:
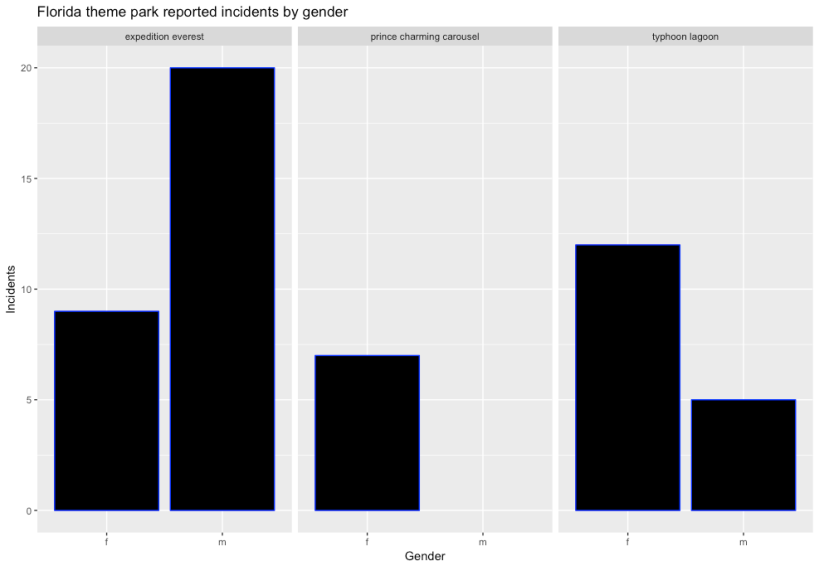 It probably strikes you looking at the middle graph what’s happening here – some rides are definitely favoured by one gender. I’m assuming here that the Prince Charming Carousel at Magic Kingdom is probably favoured by young girls, and not that there’s some witch blocking the prince from future suitors in order to maintain some curse of course. Having said that, the other two do surprise me a bit – I didn’t really think that Expedition Everest would be so heavily favoured by males. My hypothesis is that Animal Kingdom (which hosts the ride) is really not heavy on thrill rides, so the park itself is probably less aimed at males who anecdotally prefer thrill rides more. I can definitely imagine a scenario where a family split up for an hour, with Mum and the girls going to look at the animals while Dad and the boys go ride the rollercoaster with the broken Yeti (fix the Yeti!). If I’m right, Expedition Everest is not really a ‘boy ride’ like it appears, it’s just the least female-friendly ride in the park.
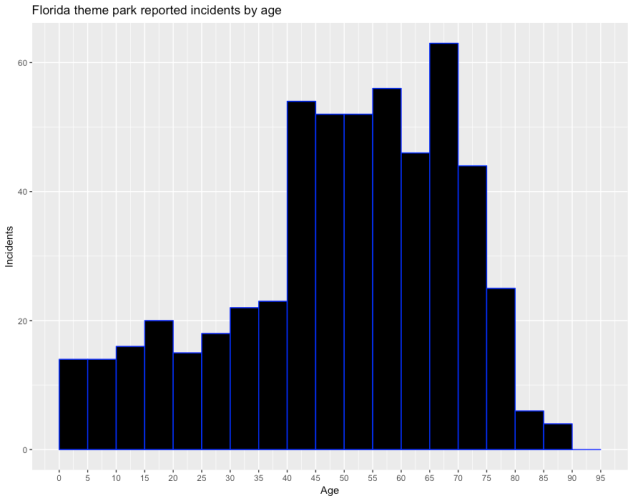
This one is a lot more interesting to me because there looks like a really clear spike at age 40-45. I really expected this one to have a smoother curve, but once again I think we’re victims of selection bias. If you think about who goes to parks, it’s still generally families with children (although my bet is that will change soon). So these 40 and above people are most likely parents, and before 40 in the US you’re unlikely to have kids of theme park age. So rather than the spike being interesting, it becomes more interesting to me to wonder why there’s so few kids – after all, they’re riding just as much if not more! My only conclusion then is that the average for under 20’s compared to the over 40’s is really an expression of how resilient kids are compared to their parents.
The next interesting part of this graph to me is the spike between 60 and 65. I think after 65 you’re really much less likely to be going to theme parks at all, so this spike might really mean something. While we really don’t have enough evidence to make a call, I’d definitely be thinking about a quieter holiday location once I get to 60.
Reporting over time
One of the biggest things I noticed when looking at the original report was that the format and standards for reporting have evolved a lot over time. In the beginning you can see that reporting was a real afterthought, and very little information was provided. Most of the work I had to do in Regex was for the first two years of the dataset, so my suspicion is that they weren’t reporting everything. This seems to play out when you graph it:
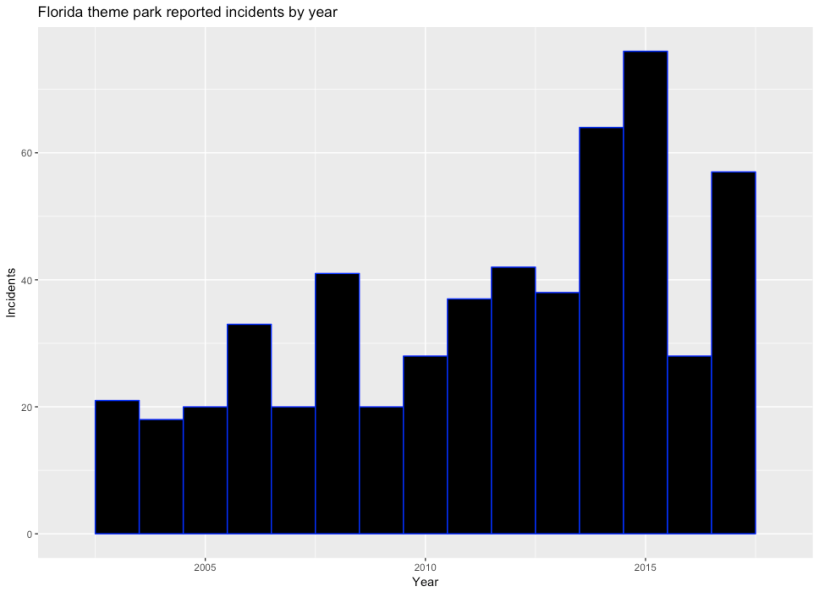
It really looks like a few things could be happening here. The first interesting thing is that more people seem to hurt themselves from 2010 onwards, but then it cuts out to 2009 levels in 2016. This could mean that parks reacted to a bad 2015 by reinforcing their safety standards, which would be a good news story. The not so good news is that in 2017 the numbers seem to climb again. There’s a few stories of how bad 2015 was, but Orlando Sentinel being blocked for me doesn’t help supplying them to you.
Incidents by ride
I wanted to save my opinion of the best for last – the incidents by ride. As with all of these graphs, the raw counts of incidents are heavily affected by popularity, which I can’t really get directly (although I’m working on it!).
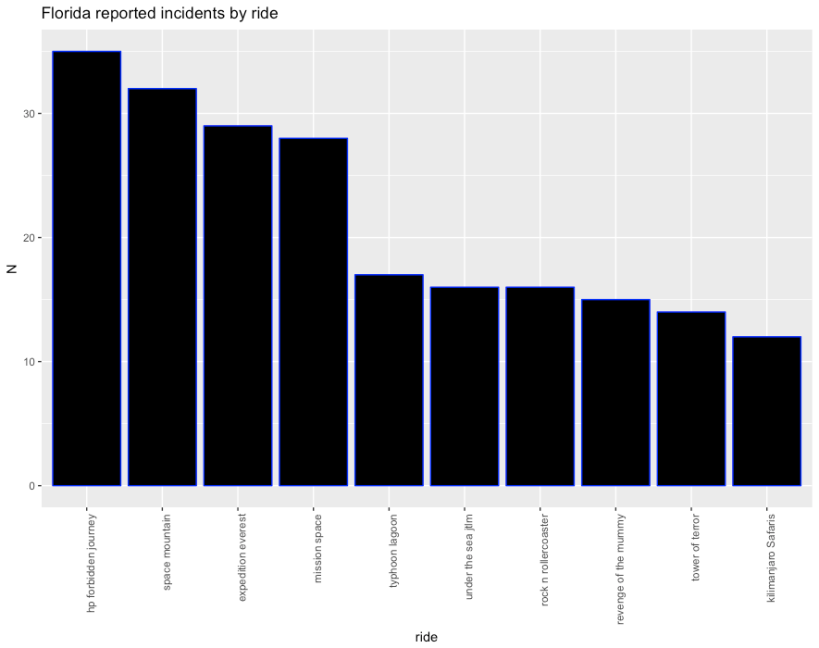
I’ve only plotted the top ten rides here, but I might show the full graph in a later article. On its own this is pretty interesting to me, because it backs up a lot of folklore about Space Mountain and Harry Potter and the Forbidden Journey being particularly intense. My first reaction was that HPFJ must be horribly built or something, but the fact that it has won awards doesn’t imply that’s correct. Then I spoke to a friend from Florida who told me that the ride is famous for people throwing up on it as it swings them around, which makes it far more likely that the high number of incidents is more due to minor incidents than anything. Space Mountain, on the other hand is an old dark coaster – a breed of ride notorious for knocking people about because the darkness means you can’t brace for the turns. Without being able to actually extract the incidents themselves well yet it’s difficult to tell for sure, but a glance at the raw data tells me that the injuries are a bit more serious on this ride. Mission Mars also has a reputation for being intense – a lot of people seem to at least get disoriented on this ride and one incident is even a 4 year old boy who died during the experience.
Expedition Everest and the case of the Yeti
The standout ride again for me is Expedition Everest, and I really can’t explain what’s going on there. It’s not known as a particularly dangerous or intense ride, and I haven’t seen any majorly new technology on it.

My only clue is the the broken Yeti. I know it’s a long shot, but the Bayesian in me is saying the fact that the Yeti only worked for a short time before staying motionless to this day indicates that something went wrong in the design process for this ride. After all, if such a major set piece turned out to operate unexpectedly, what else is operating unexpectedly? Combine it with an unusually high number of incidents for a largely outdoor rollercoaster with no inversions or particularly tight curves and there is a weak sign here that someone designed this thing wrong. Having said that, there is a reverse section of the ride (which has the same effect as a dark coaster), so it could be just that section that’s the problem. I know absolutely nothing about Disney maintenance schedules of their organisational structure, but it might be possible that Animal Kingdom doesn’t have the same number of staff assigned to structural engineering tasks as other parks. Obviously if I knew anything about their operations my hypothesis would be a lot better, but I still think this is an interesting data point.
What I learned and what I’ll do next
The first thing I’ve learned is that the Florida Government needs to start making theme parks standardise their reports and preferably submitting them as publicly available csv files. If they were doing this with drop down menus and some sort of field validation, getting reports out would be a hell of a lot easier.
Another thing I learned (while I didn’t get to make graphs of it particularly) was that it seems getting on and off a ride is more dangerous than actually being on the ride itself. While I only got to eyeball the incidents in this iteration of the analysis, I was surprised to see how many said things like ‘tripped entering vehicle, fractured ankle’ or something similar. While I don’t get the inside knowledge the Disney or Universal Data Scientists do, I’m not surprised that entering and exiting ride vehicles has so many humans involved in it, and if it were me I’d be making sure these people were permanent employees with excellent training to particularly look after people over 40.
That brings me to another thing – if you’re a parent the clear message here is that your kids will be fine and you should be far more worried about your own safety than theirs. They might be running around like maniacs, but just because the place is dangerous for you doesn’t mean it is for them!
Now that I’ve finally gained a new dataset, my next thing will probably be to try and combine it with some of the other datasets I have, like the theme park visitor numbers or (hopefully) ride wait times to indicate ride popularity. If I can line these things up it might control for the growth of the industry overall, and then I’ll be able to tell if things really are getting more dangerous or if it’s just a side-effect of increasing visitors. In addition, I’m going to try and see if I can extract a few types of incidents and do a post on which rides seem to be most deadly (which would be sad) or most sickening (which would be more fun).
If you have more ideas on where I can get data or what I could do better in my code I’d love to hear your suggestions in the comments.