
I’ve now had two attempts at predicting theme park visitor numbers, the first using Holt Winters and the second using Random Forests. Neither one really gave me results I was happy with.
Holt Winters turned out to be a misguided attempt in the first place, because most of its power comes from the seasonality in the data and I am stuck using annual measurements. Given the pathetic performance of this method, I turned to the Data Scientists go-to: Machine Learning.
The Random Forest model I built did a lot better at predicting numbers for a single year, but its predictions didn’t change much from year to year as it didn’t recognise the year of measurement as a reading of time. This meant that the ‘year’ variable was much less important than it should have been.
ARIMA: A new hope
Talking to people I work with (luckily for me I get to hang out with some of the most sophisticated and innovative Data Scientists in the world), they asked why I hadn’t tried ARIMA yet. Given that I have annual data, this method would seem to be the most appropriate and to be honest I just hadn’t thought of it because it had never crossed my path.
So I started looking into the approach, and it doesn’t seem to difficult to implement. Basically you need to at least find three numbers in place of p, d, and q: the order of the autoregressive part of the model (an effect that changes over time), the degree of differencing (the level of ‘integration’ between the other two parameters AFAIK), and the order of the moving average part of the model (the how much the level of error of the model changes over time). You can select these numbers through trial and error, or you can use the auto.arima() function in R that will give you the ‘optimal’ model that produces the least possible error from the data. Each of these parameters actually has a real interpretation, so you can actually base your ‘trial and error’ on some intelligent hypotheses about what the data are doing if you are willing to spend the time deep diving into these parameters. In my case I just went with the grid search approach with the auto.arima() function, which told me to go with p = 0 , d = 2 and q = 0.
The results
ARIMA seems to overcome both the lack of frequency in the data as well as the inability of Random Forests to take account of time as a variable. In these results I focus on the newly reinvigorated Universal vs. Disney rivalry in their two main battlegrounds – Florida and Japan.
Here are the ARIMA based predictions for the Florida parks:
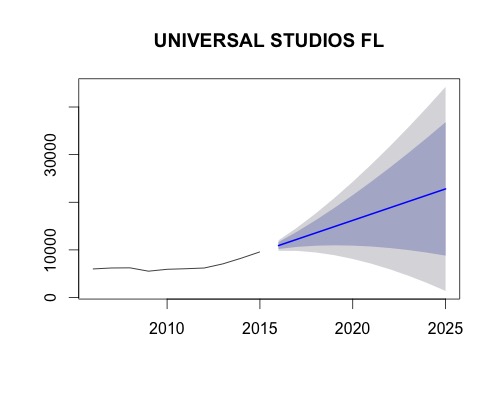
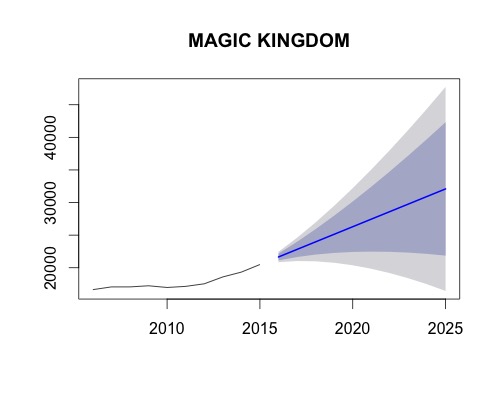
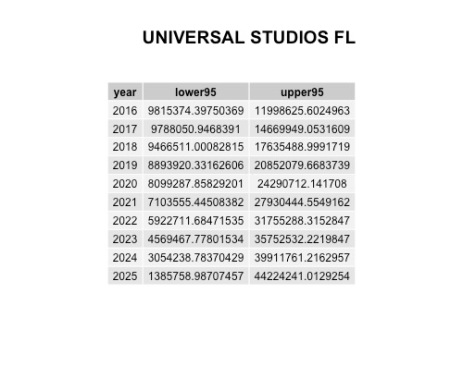
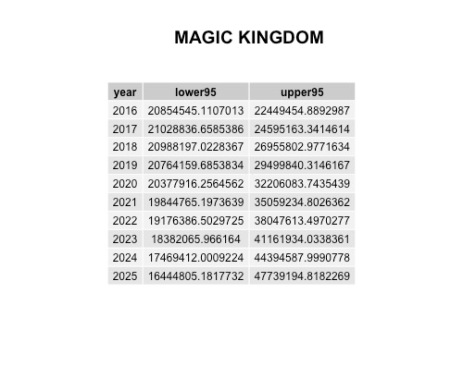
Both are definitely improving their performance over time, but as both the Holt-Winters and the Random Forest model predicted – Universal Studios is highly unlikely to catch up to Magic Kingdom in its performance. However, unlike the Holt-Winters model, the ARIMA predictions actually have Universal overtaking Disney well within the realm of possibility. Universal’s upper estimate for 2025 is just over 35 million visitors, while Magic Kingdom’s lower estimate for the same is around 25 million. In an extreme situation, it’s possible that Universal’s visitor numbers will have overtaken Magic Kingdom’s by 2025 if we go with what the ARIMA model tells us.
The story for the Japanese parks looks even better for Universal:
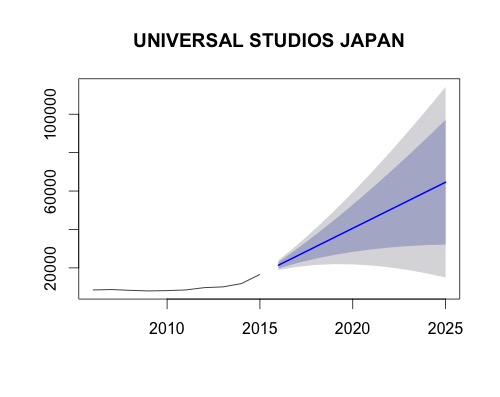
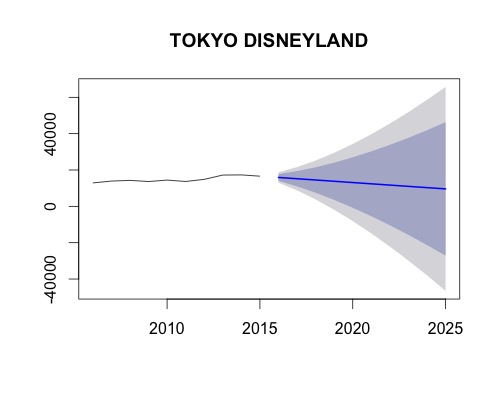
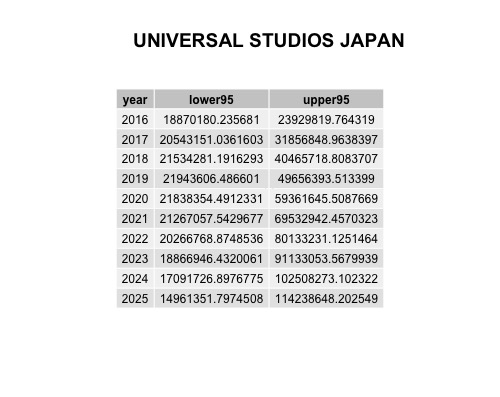
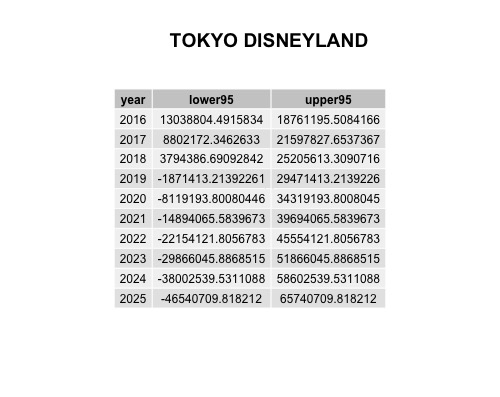
In these cases we see Universal continuing on their record-breaking rise, but things don’t look so good for Tokyo Disneyland. This is really interesting because both are pretty close replicates of their Florida counterparts and both exist in a booming market. For Tokyo Disney to not be seeing at least a predicted increase in visitor numbers, something must be reasonably off. The prediction even shows a good possibility of Tokyo Disneyland beginning to get negative visitor numbers, suggesting the park’s future may be limited.
Things I learned
ARIMA definitely seems to be the way to go with annual data, and if I go further down the prediction route (which is pretty likely to be honest) I’ll probably do so by looking at different ways of playing with this modelling approach. This time I used the grid search approach to finding my model parameters, but I’m pretty suspicious of that, not least because I can see myself stuttering to justify my choices when faced with a large panel of angry executives. “The computer told me so” seems like a pretty weak justification outside of tech companies that have the experience of trusting the computer and things going well. There is clearly a lot of better methods of finding the optimal parameters for the model, and I think it would be worth looking into this.
I’m also starting to build my suspicion that Disney’s days at the top of the theme park heap are numbered. My recent clustering showed the growing power of a new audience that I suspect is largely young people with no children who have found themselves with a little bit of expendable income all of a sudden. On the other hand, Magic Kingdom and Tokyo Disney serve a different market that arguably consists more of older visitors whose children have now grown up and don’t see the fun in attending theme parks themselves.
Future things
I’ve read about hybrid or ensemble models pretty commonly, which sounds like a useful approach. The basic idea is that you make predictions from multiple models and this produces better results than any individual model on its own. Given how terrible my previous two models have been I don’t think this would help much, but it’s possible that combining different ARIMA models of different groupings could produce better results than a single overall model. Rob Hyndman has written about such approaches recently, but has largely focussed on different ways of doing this with seasonal effects rather than overall predictions.
I also want to learn a lot more about how the ARIMA model parameters affect the final predictions, and how I can add spatial or organisational information to the predictions to make them a little more realistic. For example, I could use the ARIMA predictions for the years where I have observed numbers as input to a machine learning model, then use the future ARIMA predictions in the test data as well.
Do you think my predictions are getting more or less believable over time? What other ideas could I try to get more information out of my data? Is Universal going to be the new ruler of theme parks, throwing us into a brave new unmapped world of a young and wealthy market, or can Disney innovate fast enough to retain their post for another generation to come? Looking forward to hearing your comments.