I had a go recently at running a K-means clustering on the theme parks in the Themed Entertainment Associationreports by their opening dates and locations. This was pretty interesting in the end, and I was able to come up with a pretty nice story of how the parks all fell together.
But it made me wonder – what would it look like (and what would it mean!) if I did the same with visitor numbers?
Competing for different audiences
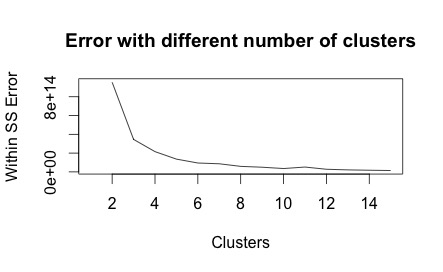
Using the elbow method I described in my previous post, I again found that three or six clusters would be useful to describe my population.

Just like last time, I probably also could defend a choice of eight or even ten clusters, but I really don’t want to be bothered describing that many groups. Joking aside, there is a limit to how many groups you can usefully produce from any cluster analysis – it’s not useful if it just adds complication.
But here’s the issue I ran into immediately:
| Universal Studios Japan | ||
| Year | Cluster (3) | Cluster (6) |
| 2006 | 2 | 3 |
| 2007 | 2 | 3 |
| 2008 | 2 | 3 |
| 2009 | 2 | 3 |
| 2010 | 2 | 3 |
| 2011 | 2 | 3 |
| 2012 | 2 | 6 |
| 2013 | 2 | 6 |
| 2014 | 2 | 6 |
| 2015 | 3 | 1 |
It moves clusters over the years! I shouldn’t really be surprised – it shows that these theme parks are changing the markets they attract as they add new attractions to the mix. Remember, in this exercise I’m describing audiences as observed by the parks they visit. In my interpretation of these results I assuming that audiences don’t change over time, but their image of the various theme parks around the world do change. Let’s look at the clusters:
Cluster 1: Magic Kingdom Crew
These are the audiences that love the Disney brand and are loyal to their prestige offerings. If they’re going to a park, it’s a Disney park.
| Cluster 1 | |
| Magic Kingdom | 2006-2015 |
| Disneyland | 2009-2015 |
| Tokyo Disney | 2013-2015 |
Cluster 2: Local Visitors
These parks are servicing local visitors from the domestic market.
| Cluster 2 | |
| Disneyland | 2006-2008 |
| Disneyland Paris | 2007-2009 |
| Tokyo Disney Sea | 2006-2015 |
| Tokyo Disneyland | 2006-2012 |
Cluster 3: The new audience
This is an audience that has only emerged recently and offering more profits, with those parks gaining their attention reaping the rewards, as seen by the membership of very successful parks in recent years.
| Cluster 3 | |
| Disney Animal Kingdom | 2006 |
| Disney California Adventure | 2012 -2014 |
| Disney Hollywood Studios | 2006 |
| Everland | 2006-2007, 2013-2015 |
| Hong Kong Disneyland | 2013 |
| Islands of Adventure | 2011-2015 |
| Ocean Park | 2012-2015 |
| Universal Studios Florida | 2013-2014 |
| Universal Studios Hollywood | 2015 |
| Universal Studios Japan | 2006- 2011 |
Cluster 4: The traditionalists
This group is defined by the type of visitor that attends Tivoli Gardens. Maybe they are more conservative than other theme park audiences, and see theme parks as a place primarily for children.
| Cluster 4 | |
| Europa Park | 2006-2014 |
| Hong Kong Disneyland | 2006-2010 |
| Islands of Adventure | 2009 |
| Nagashima Spa Land | 2006-2010 |
| Ocean Park | 2006-2009 |
| Seaworld Florida | 2010 – 2015 |
| Tivoli Gardens | 2006 -2015 |
| Universal Studios Hollywood | 2006-2011 |
Cluster 5: Asian boom market
This audience seems to be associated with the new wave of visitors from the Asian boom, as seen by the recent attention to Asian parks like Nagashima Spa Land.
| Cluster 5 | |
| Disney California Adventure | 2006-2011 |
| Europa Park | 2015 |
| Everland | 2008-2012 |
| Hong Kong Disneyland | 2011-2012, 2015 |
| Islands of Adventure | 2006-2008, 2010 |
| Nagashima Spa Land | 2011-2015 |
| Ocean Park | 2010-2011 |
| Seaworld Florida | 2006-2009, 2012 |
| Universal Studios Florida | 2006-2012 |
| Universal Studios Hollywood | 2012-2014 |
Cluster 6: Family visitors
These all seem like parks where you’d take your family for a visit, so that seems to be a likely feature of this cluster.
| Cluster 6 | |
| Disney Animal Kingdom | 2007-2015 |
| Disney California Adventure | 2015 |
| Disney Hollywood Studios | 2007-2015 |
| Disneyland Paris | 2010-2015 |
| EPCOT | 2006-2015 |
| Tokyo Disney Sea | 2011 |
| Universal Studios Florida | 2015 |
| Universal Studios Japan | 2014 |
I tried a couple of other methods- the last cluster for each park and the most frequent cluster for each park, but these really were even less informative than what I reproduced here. In the first case the clusters didn’t look much different and didn’t really change interpretation. This is probably because my interpretation relies on what I’ve learned about each of these parks, which is based on very recent information. In the second case, I reduced the number of clusters, but many of these were a single park (damn Tivoli Gardens and it’s outlier features!)
Lessons learned
This work was sloppy as anything – I really put very little faith in my interpretation. I learned here that a clustering is only as good as the data you give it, and in the next iteration I will probably try and combine the data from my previous post (some limited ‘park characteristics’) to see how that changes things. I expect the parks won’t move around between the clusters so much if I add that data, as audiences are much more localised than I’m giving them credit for.
I also learned that a simple interpretation of the data can still leave you riddled with doubt when it comes to the subjective aspects of the analysis. I have said that I am clustering ‘audience types’ here by observing how many people went to each ‘type’ of park. But I can’t really say that’s fair – just because two parks have similar numbers of visitors doesn’t imply that those are the same visitors. Intuitively it would say the opposite! I think adding in the location, owner and other information like the types of rides they have (scraping wikiDB in a future article!) would really help this.
Future stuff
Other than the couple of things I just mentioned, I’d love to start looking at the attractions different parks have and classifying them that way. Once I have the attraction data I could look at tying this to my visitor numbers or ownership data to see if I can determine which type of new attractions are most popular for visitors, or determine which attractions certain owners like the most. In addition, I can’t say I really know what these parks were like over the last ten years, nor what a lot of them are like now. Perhaps understanding more about the parks themselves would give some idea as to the types of audiences these clusters describe.
What do you think? Am I pulling stories out of thin air, or is there something to this method? Do you think the other parks in Cluster 3 will see the same success as Islands of Adventure and Universal Studios Japan have indicated they will see? I’d love to hear your thoughts.
One thought on “Clustering theme parks by their audience”